

Better Performance Insights in Less Than 4 Minutes with Scout APM


Bad software is expensive! In 2013 Amazon lost $4.8M in under an hour due to a software glitch. This example highlights how low quality code can cost a fortune when you have to absorb system failures or scrap projects. Yet even without alarming malfunctions, low quality code costs businesses every day for things like wasteful and unnecessary performance, lengthy searches to fix defects, and “technical debt,” or those easy, short-term solutions that cost a lot more in the long run.
Producing better quality code helps businesses to lower risk and operating costs. It also benefits developers by reducing drawn out, wearisome searching for and rewriting code. According to a 2018 report, “The key strategy for reducing the cost of poor software quality is to find and fix problems and deficiencies as close to the source as possible, or better yet, prevent them from happening in the first place.”
One of the best software companies helping solve this problem is called Scout APM. Scout APM provides software that immediately locates costly defects in production code and displays metrics and more through an interactive user interface. Their software supports Ruby, Elixir, Python, PHP, and NodeJS applications. Additionally, projects in other languages can use Scout’s Core Agent API via a Unix Domain Socket.
Deploying Scout APM in production code is easy because there are only 3 steps. First, you run your gemfile and shell commands,`gem ‘scout_apm’` and `bundle install`. Second, download your customized config file* (available within your Scout account) and place it at config/scout_apm.yml. Lastly, deploy!

As your production code runs, Scout APM provides live updates on many different performance metrics. These metrics get displayed in an interactive user interface. One such feature, as shown above, compares application performance over time. If the code is working faster in the morning versus the evening then you will see that. Scout APM then locates multiple pain points where code is slowing down the program.
The languages Scout APM supports are commonly used for web development and data projects. Perhaps the most common side effect of low-quality code in web and data projects, or any project, is slow processing. The challenge for developers is locating what part of the code is slow and why. A couple reasons for slow application processing are N+1 queries and memory bloat.
N+1 queries refers to a very common form of wasteful and inefficient database querying. Imagine you have a database for product inventory and you want to select 1 product. Then, you want to select the price for that product. You’ve made 2 separate “queries”- requests for data from a database. Each request takes some milliseconds. Now, say you want to select 10 products. Often at this point the developer makes 1 query to retrieve 10 products, and 10 queries to retrieve each price. Every query’s execution time adds up from unnoticeable, to slow, all the way up to crashing the application.
The other common problem I mentioned is memory bloat. Memory bloat refers to code processes that take up way more memory than they should. Like N+1, memory bloat problems are common, preventable, and hard to detect. Unfortunately, many businesses first discover memory bloat when an application is too slow or crashes. What follows is a long, headache-inducing and expensive discovery process to find and fix the cause.
Scout APM finds problems like N+1 and memory bloat by displaying performance metrics for controller-action, background job workers, and other processes that cause elusive problems.

You can sort the live results by response time, object allocations, date, and more. Additionally, Scout APM collects detailed transactions across web endpoints to visualize “hotspots” of low-quality code. Instead of having a software developer or engineer review the code line-by-line to locate an N+1 query, verify it, then form a solution, Scout APM finds and displays them alongside many other deficiencies.
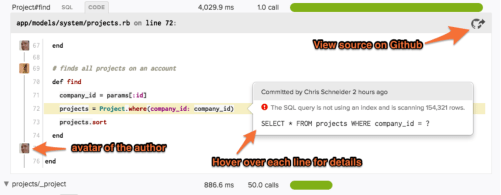
Scout then provides tracing logic for the order of events to locate the problematic code down to the line. Using Scout, you can understand trace views with two different displays. The “Summary View” aggregates method calls together and orders them from most to least expensive. The “Timeline View” actually shows the execution order of calls as they occur during the transaction. This is useful for answering questions like is there a lot of time spent in your custom code at the beginning of a request? Is it spread out? Is it at the end of a request? Is one instance of many nearly identical queries slow or all of them? What was the slowest request yesterday? Which endpoints are generating the bulk of slow requests? (scoutapm.com)
My favorite feature of Scout APM is with every metric, they provide information like author, commit date, and deploy time. In other words, you will know real-time what the problem is, have tracing logic to show you which lines of code are causing it, and then learn who knows that section of code best so the right person can fix it.
Businesses pay to operate on low-quality code every day. They accrue technical debt from slow performance and memory bloat. They pay for hours of searching for problems. They pay when an application crashes altogether. But mostly they pay for reputational damage and the bottom-line (it-cisq.org). Solving these issues is an iterative process, and Scout APM helps by finding deficiencies before they become too expensive in an interactive and simple user interface. To learn more about Scout APM and developing better software, consider signing up for a free 14-day trial with no credit card required here.


