

In with the New: Python Plotting and Data Wrangling Libraries


by Markus Schmitt of Data Revenue
Is it time to replace Matplotlib and Pandas?
Programmers enjoy pitting different pieces of software libraries against each other. Tensorflow vs. Pytorch? Vim vs. Emacs? Python vs. R?
If we accept this metaphor of software competing in a kind of global popularity contest, we might look at Pandas and Matplotlib as the incumbents in the Python data science arena. They are two of the oldest and most widely used libraries for data wrangling and visualization, respectively.
Continuing this metaphor, we also have several interesting challengers. In the data wrangling space, libraries like Dask, Vaex, and Modin offer some advantages over Pandas, although they are less mature. Similarly, in the large Python visualization landscape, Bokeh and Seaborn (and a host of others) are challenging Matplotlib, offering simpler APIs, more aesthetic defaults, and modern features such as interactivity.
In this article, we will:
- Look at some trending Python libraries and discuss why they might be interesting for data scientists and machine learning engineers;
- Compare these to Matplotlib and Pandas;
- Conclude that the “fighting” metaphor doesn’t fit. You wouldn’t ask whether a butter knife was “better” than a bread knife – they do different things. Similarly, which Python tool you should use will usually depend on your task, and these tools can often be used to support each other.
Data wrangling
Incumbent: Pandas
Why it’s popular: Simplicity, maturity, and flexibility
Problems: Inefficient, not scalable, and often limited to a single thread
Challengers: Dask, Modin, Vaex, and RAPIDS cuDF (detailed comparison)
Pandas is the library people love to hate. Even its creator has given it a scathing critique. Nonetheless, it’s an essential tool for many data scientists, and it provides simple workflows for:
- Reading data from different file formats, including JSON and CSV;
- Loading data into DataFrame objects;
- Manipulating data by filtering, transforming, or aggregating;
- Visualizing data via tight integration with Matplotlib.
However, because Pandas was built with such a strong focus on simplicity and flexibility, it falls short in other areas – especially efficiency and scaling to large datasets.
How do other libraries address these problems?
All the challenger libraries we’re going to look at try to preserve Pandas’ familiarity by implementing some or all of its API, while addressing the efficiency concerns by scaling to more powerful hardware (using multicore processing, GPU processing, or cluster computing) or using cleverer algorithms (such as lazy evaluation and memory mapping).
Modin
Modin is the simplest of these, and it aims to provide a full drop-in replacement for Pandas. If you have existing Pandas code, you can often benefit from Modin’s power by changing just a single line of code. Most scripts import Pandas as:
import pandas as pd
You can use Modin by changing this line in your scripts to:
import modin.pandas as pd
There’s a bit of set-up required before you can do this. You need to install Modin via pip or similar, and then install Dask or Ray, the backends Modin runs on. But once you’ve done this, everything should Just Work.
Use it if your existing code relies heavily on Pandas and you’re looking for the simplest way to do initial optimizations.
Don’t use it if you need more control over exactly how you handle scaling, or if efficiency is more important to you than simplicity.
Vaex
Like Modin, Vaex implements some of Pandas’ API and can often be used as an alternative. Unlike Modin, Vaex doesn’t aim for full compatibility with Pandas. Instead, it mainly focuses on exploration and visualization. With Vaex, you can explore and visualize datasets on your normal laptop, even if they’re larger than your computer’s available memory.
Vaex does this through a combination of lazy evaluation (ensuring it doesn’t waste resources doing unnecessary calculations) and memory mapping (treating files on disk as if they were stored in memory).
Use it if you want to explore and visualize a large dataset on normal hardware.
Don’t use it if you need to do more advanced data manipulation or scale to clusters of machines.
Dask
While Modin can be powered by Dask, Dask also provides a high-level, Pandas-like library called Dask.Dataframe. Like Modin, this library implements many of the same methods as Pandas, which means it can fully replace Pandas in some scenarios. Like Vaex, Dask uses lazy evaluation to eke out extra efficiency from your hardware.
Unlike Modin, Dask doesn’t aim for full compatibility with the Pandas API, and instead chooses to break Pandas where necessary for extra power.
Dask also offers far more functionality than either Vaex or Modin. While those libraries only offer their own DataFrame-like functionality (e.g. as a Pandas replacement), Dask can be used to scale any Python code, and it offers Numpy and scikit-learn replacements as well.
Use it if you need to scale to huge datasets and use compute clusters.
Don’t use it if you’re not ready to deal with some extra complexity in your projects.
RAPIDS cuDF
While the other libraries we’ve looked at use RAM and CPUs more effectively, RAPIDS is built to work with NVIDIA GPUs. Similarly to Dask, RAPIDS offers a suite of tools with alternatives not only for Pandas, but also for scikit-learn.
RAPIDS focuses on data science use cases and aims to enable developers to process full data science pipelines on GPUs, instead of switching data between GPUs and CPUs at different stages.
Use it if you have access to NVIDIA GPUs and want to use these to speed up your Python data science pipelines.
Don’t use it if you don’t have GPUs available.
Plotting and visualization
Incumbent: Matplotlib
Why it’s popular: Maturity and flexibility
Problems: Verbose, default settings are ugly, and doesn’t do interactive visualizations well
Challengers: Seaborn, Bokeh, Plotly, Datashader
Matplotlib is the go-to Python visualization library for many developers. It has broad functionality, allowing you to build just about any kind of chart you can imagine, and it integrates well with other libraries, such as Pandas.
However, the charts it produces by default are ugly, and building them often requires more lines of code than newer visualization libraries. Also, Matplotlib was built mainly to produce static image files, such as PNGs. If you need to embed visualizations in web dashboards or make them interactive, you’ll want to look at alternatives.
How do other libraries address these problems?
There are dozens of popular Python visualization libraries. If you want a complete overview, you should watch Jake VanderPlas’s talk on the topic. We’ll cover a subset of them here. These newer libraries provide prettier defaults, more concise code, better JavaScript integrations, and more efficiency.
Seaborn
Seaborn is usually the first Matplotlib alternative people turn to. It’s built on top of Matplotlib and offers better-looking defaults and a higher-level interface for common plot types. The downside is that it’s more limited. There are some customizations and plots you can produce in Matplotlib that you can’t produce when you’re only using Seaborn.
However, Seaborn is built to be used alongside Matplotlib, so when you hit its limits, it’s easy to fall back on some Matplotlib code to fill in any gaps.
Use it if you want non-interactive images with better defaults and more concise code than Matplotlib.
Don’t use it if you need interactive plots or dashboards.
Bokeh
While Seaborn aims to make Matplotlib’s existing functionality easier to work with, Bokeh adds new functionality. Specifically, Bokeh builds interactive visualizations. You just define the plots using Python, and Bokeh automatically creates the required JavaScript.
Bokeh is a great choice if you need to publish your plots as part of a web application or an HTML- and JavaScript-based report.
Use it if you need to generate interactive plots or dashboards.
Don’t use it if you like writing JavaScript yourself or just need static images.
Plotly
Plotly is similar to Bokeh in that it builds interactive plots, generating the required JavaScript from Python. It also powers Dash, a larger framework used for building full web applications.
Use it if you need to generate interactive plots or dashboards.
Don’t use it if you like writing JavaScript yourself or just need static images.
Datashader
Unlike the other libraries above, which focus on creating plots and graphs, Datashader focuses on visualizing large datasets. For example, the plot below was generated from a huge dataset with Datashader to show population density in the USA.
Because Datashader is designed to work with large datasets, it focuses far more on performance and efficiency than the other libraries, but it’s not well suited to generating more basic graphs, such as scatterplots.
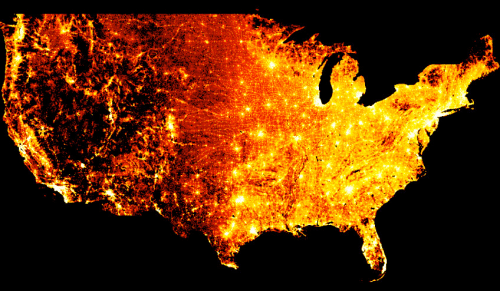
Datashader can be used to visualize large data, such as US census data
Use it if you need to generate plots from really large datasets or with millions of points.
Don’t use it if you just need a standard line, bar or other simple plot on a small dataset.
Conclusion
Pandas and Matplotlib are often the default choices for data scientists and Python programmers. Powerful and mature as these libraries are, they have some flaws, and there are dozens of alternatives that address these.
Which one is best for you will depend on your precise problem, but in many cases the newer “challenger” libraries should be seen as supporting the older incumbents instead of competing with them.


