Inside DoorDash: Machine Learning and Logistics
DoorDash is a company that connects customers to their favorite restaurants. By using the app or desktop site users can order food from a local restaurant. Then drivers for DoorDash will pick up the customers food and drive it to them. That chain of events from customer order to restaurant preparation to driver pickup to […]
DoorDash is a company that connects customers to their favorite restaurants. By using the app or desktop site users can order food from a local restaurant. Then drivers for DoorDash will pick up the customers food and drive it to them. That chain of events from customer order to restaurant preparation to driver pickup to driver delivery is a complex task. In this episode of Software Engineering Daily, DoorDash data scientist and software engineer, Raghav Ramesh, discussed the infrastructure of DoorDash’s data and how they use machine learning tools to run their service.
Ramesh started with a broad macro-level overview of how the process works. The first step, naturally, is that a customer has to place an order. “From there on, there are two processes that are set in motion,” he said. “One is we send the order to the merchant so they can start preparing the food. On the other side, the DoorDash logistic system tries to figure out the best dasher who can go, pick up the food from the restaurant and deliver it to you.”
 Machine Learning often involves several nodes connected to form a mesh.
From there Ramesh shifted into a conversation about how all the transactional data is stored for key events like customer orders, delivery pickup, or delivery drop off.“ Those transactions are recorded in the main database, which currently is Amazon’s Aurora, which is a Postgres engine,” Ramesh explained. Since Ramesh is a data scientist he needs to be able to analyze the data. He explained that once the transactional data is stored it is then moved over to an analytics database. They use Red Shift as the data lake. Apache Airflow is utilized in order to schedule the ETL (extract, transform, load) tasks to move the data from transactional to analytical. Ramesh said that at DoorDash they run the ETL tasks every day in order to transform transactional data to analytic data.
The conversation shifted to the subject of using machine learning to solve the routing problem. “The other area where machine learning plays a huge role is on the logistic system, which controls the delivery experience,” Ramesh said. “How do we solve this routing optimization in the most optimal way?” The routing problem, as described, is when you have a number of products to be delivered, a number of drivers, and a number of stops in between. What is the most optimal path to get the products to their destination? But there’s an extra problem for DoorDash. “What makes it challenging for DoorDash is the real-time nature of the product. In case of UPS or FedEx, you know the orders beforehand.” In the case of DoorDash orders come in at all hours. As Ramesh pointed out, no one wants to wait two hours for their food. They want it in a timely manner, somewhere in the 30-40 minute range.
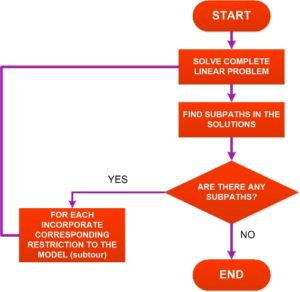 A diagram of Integer Programming.
In order to solve this routing problem, DoorDash uses a “variation of integer programming.” Ramesh explained to SE Daily that the machine learning functions they use are for the inputs for the optimization process to make the best delivery routes. The machine learning program uses a variety of inputs including time to make food, parking, and who are the nearest delivery dashers to pick up the food. In other words, it’s not as simple as looking at Google Maps to see how long it takes to get from the restaurant to the customer’s location.
Ramesh pivoted the conversation into how they take all the data to create updates to the machine learning models. First, they use the data to train a new model. They backtest it on historical data. Then they will put the new model into production as a shadow. This means that two different machine learning models are running at the same time. However, only the production model is actually creating predictions that affect the way DoorDash’s services work. Once satisfied with the new model, they will then roll it out using A-B experiments. So long as everything is working as intended, they increase the number of users seeing the B model until the A model has been completely phased out.
The conversation moved onto DoorDash’s infrastructure as a company. According to Ramesh, there is a centralized data analytics team. Meanwhile, there are machine learning engineers assigned to each department. He gave an example in which the company would want to focus on better predicting demand. “You would have a team that’s a backend engineer, a machine learning engineer, a data scientist, and a product manager. You would get together, figure out what problems you are going after, identifying the models you would build, identify what a data scientist could help with and what a machine learning engineer could bring in and you share the work accordingly.”
Then Ramesh gave an overview of what tools they use at DoorDash for machine learning. “We mostly use Python-based open source libraries, the scikit-learn, LightGBMs of the world,” he said. “The other package is Keras.” He went on to state that on the analytic side they use a mix of Python and R for exploratory analysis and visualization. For business reporting, they use Charteo and Tableau.
Ramesh concluded his interview with the following thought on the state of machine learning. “It’s super early days in the whole machine learning industry.” He went on to explain that, “The hard part of machine learning is not really the algorithms piece. It’s not really figuring out how to get the best accuracy, but more figuring out how the rest of the ecosystem works with that. How do you manage the lifecycle of a model? How do you track the various data pipelines that feed into this?” Later he added, “We are working around this to get us more confidence in building and deploying machine learning models.”
Transcript
EPISODE 653
[INTRODUCTION]
[0:00:00.3] JM: DoorDash is a logistics company that connects customers, restaurants and drivers that can move food to its destination. When a customer orders from a restaurant, DoorDash needs to identify the ideal driver for picking up the order from the restaurant and dropping it off with the customer.
The process of matching an order to a driver takes in many different factors. Let’s say I order spaghetti from an Italian restaurant. How long does the spaghetti take to prepare? How much traffic is there in a different area of the city versus this area of the city, and do I have to traverse this different traffic in order to take the spaghetti to the customer? Who are the different drivers who could potentially pick the spaghetti up? Are there other orders near the Italian restaurant that we could co-schedule the spaghetti delivery with? In order to perform this matching of drivers and orders, DoorDash builds machine learning models that take into account historical data and all of these factors that may be going on in real time.
In today’s episode, Raghav Ramesh explains how DoorDash’s data platform works and how that data is used to build machine learning models that can connect drivers to the appropriate meals that they could deliver to customers in an expedient fashion. We explore this machine learning model building process. We explore the machine learning model release process, which involves back testing, and shadowing, and gradual rollout. This was a really thorough episode of building a particular machine learning model.
One thing that I’m increasingly understanding is how much of this machine learning process is about data infrastructure and planning, and doesn’t have as much to do with, “Can you understand how a neural net works?” It’s all about the infrastructure, at least in many of the applied scenarios that companies are dealing with today. I think you’ll understand that from this episode.
Before we get started, I want to plug that I’m hiring for a new company that I’m starting, and I can’t talk about the product quite yet, but I’m very excited about it, and I’m looking for an engineer in the Bay Area with significant experience in React.js and either AWS or Google Cloud, and you can email me at jeff@softwareengineeringdaily.com or you can check out the job posting at softwareengineeringdaily.com/jobs. I would love to hear from you.
[SPONSOR MESSAGE]
[0:02:44.7] JM: Cloud computing can get expensive. If you’re spending too much money on your cloud infrastructure, check out DoIt International. DoIt International helps startups optimize the cost of their workloads across Google Cloud and AWS so that the startups can spend more time building their new software and less time reducing their cost.
DoIt international helps clients optimize their costs, and if your cloud bill is over $10,000 per month, you can get a free cost optimization assessment by going to D-O-I-T-I-N-T-L.com/ sedaily. That’s a D-O-I-T-I-N-T-L.com/sedaily. This assessment will show you how you can save money on your cloud, and DoIt International is offering it to our listeners for free. They normally charge $5,000 for this assessment, but DoIt International is offering it free to listeners of the show with more than $10,000 in monthly spend. If you don’t know whether or not you’re spending $10,000, if your company is that big, there’s a good chance you’re spending $10,000.
So maybe go ask somebody else in the finance department.
DoIt International is a company that’s made up of experts in cloud engineering and optimization. They can help you run your infrastructure more efficiently by helping you use commitments, spot instances, rightsizing and unique purchasing techniques. This to me sounds extremely domainspecific. So it makes sense to me from that perspective to hire a team of people who can help you figure out how to implement these techniques.
DoIt International can help you write more efficient code. They can help you build more efficient infrastructure. They also have their own custom software that they’ve written, which is a complete cost optimization platform for Google cloud, and that’s available at reoptimize.io as a free service if you want check out what DoIT International is capable of building.
DoIt International art experts in cloud cost optimization, and if you’re spending more than $10,000, you can get a free assessment by going to D-O-I-T-I-N-T-L.com/sedaily and see how much money you can save on your cloud deployment.
[INTERVIEW]
[0:05:08.3] JM: Raghav Ramesh, you are a data scientist and software engineer at DoorDash.
Welcome to Software Engineering Daily.
[0:05:14.0] RR: Thanks, Jeff. Thanks for having me.
[0:05:15.7] JM: Absolutely. So DoorDash is a delivery service. It operates in many cities around the United States. Let’s say I open the app, I order a sandwich from a restaurant. That sandwich gets delivered to me. Describe at a high level how that request makes its way through the app and through the various pieces of infrastructure.
[0:05:36.5] RR: Yeah. DoorDash is a technology company that connects customers with their favorite local and national businesses. We actually operate in thousand cities across the U.S. and Canada. So as a consumer, when you place an order on DoorDash, you can pick from any of the many merchants we have. From there on, there are two processes that are set in motion. One is we send the order to the merchant so they can start preparing the food. On the other side, the DoorDash logistic system tries to figure out the best dasher who can go, pick up the food from the restaurant and deliver it to you. The basic operations is pretty straightforward. You place an order, merchant starts preparing the food, a dasher picks it up from the merchant and gives it to you.
[0:06:26.3] JM: What are the different places where machine learning touches and affects that process?
[0:06:31.9] RR: Yeah, that’s a good question. The way I see it is machine learning operates in two big domains. One on improving the consumer experience, and other on improving the delivery experience. An example of the first category would be when you open the app, there are, let’s say, thousand restaurants that we could show you. How do we figure out the best content to surface for you? How do we figure out what you really want at this point and show it at the top. That’s an example of machine learning model in particular recommendation model.
Another example of this type is for the dasher, we tell them what’s the best opportunity to earn money today. When they open the app they see, “Oh, if you go at this particular place on this particular time, you’re going to make the most money.” There’s a higher chance of earnings.
That’s on the consumer side.
The other area where machine learning plays a huge role is on the logistic system, which controls the delivery experience, which is we have a set of deliveries. We have a set of dashes.
How do we solve this routing optimization in the most optimal way?
[0:07:42.5] JM: The architecture of DoorDash could be broken down into several different categories. When I think about it, I think of – I’m talking about the backend infrastructure. The backend infrastructure I think of as you’ve got the business logic, the logic for just processing requests from a user and sending out push notifications, etc. You’ve got the data platform. Where do you store the data? How do you manage the transactional data as well as the analytical data and the data warehousing and etc.
Then you’ve also got the machine learning infrastructure. Is that a good way of breaking down the components of your software architecture on the backend, or are there any other pieces to it that we should outline before we dive into it?
[0:08:34.6] RR: No, that’s perfect.
[0:08:35.9] JM: Okay. So let’s start with just the transactional backend side. Can you give me an overview of how a transaction is processed on DoorDash’s side? How a request is processed and how it makes its way through your backend?
[0:08:52.7] RR: Yeah. When users interact with DoorDash, they interact through the app or the website, and that hits a web service backend. Any transaction that comes through to, say, an order is being placed. A dasher signs on to the platform. An order has been picked up. Those transactions are recorded in the main database, which currently in Amazon’s Aurora, which is a PostgreS engine. That’s where the transactional data is stores. Multiple services would then operate on this data.
[0:09:23.3] JM: How does the transactional data makes it way into a data lake or whatever other kind of data system for doing large scale analytics? Because I presume you’re not just, for example, running machine learning jobs or batch processing jobs over the production PostgreS data?
[0:09:49.6] RR: That’s right. Yeah. Running it on the production database would be a bad idea.
[0:09:53.3] JM: Let’s actually just pause there. Why would it be a bad idea to run machine learning jobs and batch jobs over the production database?
[0:10:00.7] RR: So there are multiple reasons. The most important I’ve heard is you don’t want non-critical jobs, non-production jobs to be hitting the production database and adding more load to the system that way. That’s the main reason.
[0:10:16.2] JM: Are there any cost concerns?
[0:10:17.9] RR: I’m not an expert in that area, on the cost side of it, but there’s another difference that I could think of, which is the production database is a transactional database. So if you use PostgreS, that’s a raw-based storage system. But for analytics purposes and for running machine learning models where you are joining on a lot of tables, you want the database to be structured differently, particularly in a columnar storage. That’s another difference why it’s more efficient to use a different database setup for the analytic purposes
[0:10:49.6] JM: Okay. So what’s the process of getting that data from the transactional database into a data format that’s more amendable to large scale analytics?
[0:11:02.6] RR: Yeah. At DoorDash, we use Red Shift as the analytics database, the data lake. The way data gets from the PostgreS transactional database into Red Shift for analytics purpose, is through a set of ETL jobs. ETL is extract, transform and load, where you could, one, fetch the data you want, transform it into different types, different aggregations you could do. For example, let’s say you have a table on the transactional side, which records all events on a delivery.
But on the analytics side, you presumably want an aggregate view. For example, how many deliveries did we do on this particular day in San Francisco, and what’s the average delivery times in New York versus in Texas? These come out of ETL malleable ETL jobs, which encode this logic and they end up in the data lake. We use Airflow for the scheduling part of the ETL jobs.
[0:12:11.7] JM: ETL is a term that people may not be familiar with. My understanding of ETL is that it’s how you pull from the transactional data storage system to the analytics storage system. So you might have an ETL job that runs every hour, or two hours, or 24 hours that grabs all of the new transactions, like all the new orders that have come in and you transfer it to the analytic processing system, the data lake system. Is that an accurate way of putting it?
[0:12:47.1] RR: That’s pretty accurate. Yeah.
[0:12:47.8] JM: Can you tell me more about that ETL process of transferring things from the transactional store to the analytics store?
[0:12:56.2] RR: In what way?
[0:12:57.1] JM: I guess are there any more details to it? How frequently do you have to do it and do you have to do any transformations on the data to get it into a format for analytic processing?
[0:13:07.5] RR: Yeah. At DoorDash, we run it every day, which fits in with the cadence that we want for our systems, but you could also do it multiple times a day. The data format is more around the use cases that you have for the output of the ETL jobs. For example, there are multiple customers for the data lake. One would be business reporting, which should be various business metrics that we track. One would be the input to the machine learning jobs we run. In which case, we have some data, which are further transformed into a set of features that we would use for our machine learning jobs. So the constraints are more around designing the structure for the use cases.
[0:13:53.5] JM: Okay. Did you say you use Red Shift for the data lake, or you said that’s more for the data warehouse? Those are two different terms, right? Data lake versus data warehouse.
[0:14:04.3] RR: Yeah. Currently we use Red Shift sort of for both. The ETL’s output ends up in Red Shift. There are multiple databases within Red Shift where it ends up in, and different customers use it from there.
[0:14:18.2] JM: Oh, is Red Shift like a HDFS, like a file system together with various ways of pulling those files into memory and accessing them at a faster speed?
[0:14:30.7] RR: No. Red Shift is actually an analytics database running on the PostgreS engine.
[0:14:35.4] JM: Okay. Is there some place where – Because I assume you don’t want to pull all – You don’t want to have all of your analytic data in Red Shift at all times, because that would be very expensive. Do you know if there are – Is there some intermediate file layer that the data sits in?
[0:14:52.4] RR: That’s probably a better question for the data infrastructure folks.
[0:14:54.9] JM: Okay.
[0:14:55.5] RR: Yeah.
[0:14:55.9] JM: No problem. No problem.
[0:14:56.7] RR: I know we are looking into other storage systems for this, but I’m more a consumer of those systems rather than the person working on it.
[0:15:03.6] JM: Sure. Yeah, it’s totally fair. I did a show a while ago with Uber about their data platform and it kind of opened my eyes, because it was the first time – I had done a bunch of shows in the past about various assets of a “data platform”, but I have not dove into the entire end-to-end data platform. So it’s interesting to hear, that was the first time I had heard about the whole process of recording the transactions between the users and the workers, etc., and then how that data gets pulled into a data lake and maybe you store it in HDFS in these columnar files, and then you can do all kinds of things with the columnar files, like pull it into memory and then do operations on Red Shift or other analytic databases. You could do all kinds of things with that data lake. Then once you’ve pulled it from the data lake into the OLAP, the OPAL, the analytic, the in-memory analytic system, like you said with Red Shift, you can do all kinds of things on top of that platform. Since you have Red Shift, it’s got a high volume of data inmemory. You could do things like run BI queries, or do ad hoc data science, or build machine learning models, and you’d have this machine learning models be training off of the in-memory data from the data warehouse, like Red Shift.
[0:16:24.1] RR: Yeah, that’s right. What we do is we have machine learning jobs that read data from Red Shift and train on top of that. That’s right.
[0:16:34.7] JM: So tell me more about your interaction as essentially a customer of the data platform, as a user of the data platform. You’re doing data science. You’re doing machine learning on top of the data platform. What kinds of APIs? What interactions do you want out of that analytic data? When you want to access all of the orders over some period of time or over the entirety of history, or all the star ratings for restaurants, tell me what APIs you want out of the data platform?
[0:17:05.8] RR: Yeah. For machine learning, there are two specific stages. One is the training stage, where you look at historical data and train a model. The second stage is predication stage, where you have new data and you use the model that you trained and make predictions on.
For the first part, the training part, we directly depend on the data infrastructure to get the underlying data. The requirements here are, one, we want multiple data sources to be easily accessible so that we could join. For example, we could have some aggregate data on deliveries and we could have certain other data on regions or at a county level. Aggregating these two data service is important.
Another feature that we found to be useful is when you build a lot of machine learning models, they tend to reuse a lot of features. For example, we have a model, let’s say, for predicting delivery times. The average parking times in a particular location might be a feature. When we have another model that predicts dasher travel times, the parking time could also be a feature there.
So identifying and extracting out these common features and exposing them in a standardized table and a standardized format is another requirement that we see from the data infra side.
[0:18:36.4] JM: That’s so interesting. So because you have different features and you’re going to be reusing these features in different machine learning models, what’s the format of a feature? What scheme does a feature consist of?
[0:18:53.1] RR: Yeah. There are multiple types of features. The one that I just described on is what you can think of as historical aggregates, which is some aggregation, either taking an average or taking the variants or taking the sum over a certain time window on a particular dimension. For example, a time window could be the last one week, or the last three months, or the last six months. A particular dimension could be a store, a region, or a country let’s say. So the feature is the average delivery times over the past one week in a particular region. The schema is a time component to it, a dimension component to it and a particular aggregation.
[0:19:45.2] JM: The features, do you rerun the features every night? Do you have some – I assume you’re retraining certain models every night and it sounds like maybe there’s a sequential process to it, like first you maybe retrain all you features and then you retrain all the models on those features. Is there some process like that?
[0:20:07.6] RR: Yeah, that’s right. So if you talk about the data flow, the first thing that happens is the transactional data gets converted through the ETL jobs, into the analytics database. The features jobs could use the output of the analytics tables and produce those feature tables. This could be a table with multiple features, for example, past four weeks average delivery times. The models then take these as input, combine with maybe other sort of features and the output of this would be the models that’s trained.
So you start with the transactional data, move into analytics data, then to the features, then to the job that translates it into features, and then to the job that reads the features and outputs a model. Subsequently, this model would be used in your production system to make predictions.
[SPONSOR MESSAGE]
[0:21:13.4] JM: Accenture is hiring software engineers and architects skilled in modern cloud native tech. If you’re looking for a job, check out open opportunities at accenture.com/cloudnative-careers. That’s accenture.com/cloud-native-careers.
Working with over 90% of the Fortune 100 companies, Accenture is creating innovative, cuttingedge applications for the cloud, and they are the number one integrator for Amazon Web Services, Microsoft Azure, Google Cloud Platform and more. Accenture innovators come from diverse backgrounds and cultures and they work together to solve client’s most challenging problems.
Accenture is committed to developing talent, empowering you with leading edge technology and providing exceptional support to shape your future and work with a global collective that’s shaping the future of technology.
Accenture’s technology academy, established with MIT, is just one example of how they will equip you with the latest tech skills. That’s why they’ve been recognized on Fortune 100’s best companies to work for list for 10 consecutive years.
Grow your career while continuously learning, creating and applying new cloud solutions now. Apply for a job at Accenture today by going to accenture.com/cloud-native-careers. That’s accenture.com/cloud-native-careers.
[INTERVIEW CONTINUED]
[0:22:52.1] JM: Are these different components of the data engineering process, are these defined in Airflow?
[0:23:00.7] RR: That’s right. These are defined as different Airflow jobs. So the dependency management is executed easily, and that’s about it. These are Airflow jobs. That’s right.
[0:23:15.8] JM: Can you tell me more about Airflow? What makes Airflow a desirable technology, and what is an Airflow job? Because, I mean, I could just specify these things as – Actually, I don’t know what else I would use. Tell me more about what makes Airflow a desirable technology.
[0:23:29.7] RR: Yeah, there are a few other options in the market. Airflow seems to be the simplest of them all. What does Airflow provide us? It provides us with a way to define a dependency tree, which is execute these jobs first and then these other jobs depend on the first set of jobs to be completed. It gives you this dependency tree that you could execute in a predefined order. So it’s traditionally called a DAG, which is a directed acyclic graph. So Airflow provides a way of defining these jobs as a graph and executing them.
What makes it desirable is that it controls and it abstracts out a lot of the details, where potentially you want to [inaudible 0:24:16.6] the jobs for network failures. You want some sort of a management between the central node and the multiple nodes that are running the various jobs. Those are the details that Airflow takes care of.
[0:24:28.3] JM: So I guess an example here would be the machine learning training process. You want to put a dependency on the feature aggregation process to run before the machine learning training process.
[0:24:43.7] RR: That’s right. More generally you could say all the common set of features would run first, and then the special sort of features would run next. Then the training would run after the features jobs.
[0:24:55.4] JM: Let’s dive in to a specific problem, a specific machine learning problem. So, routing. The routing problem is a classic example of – I think it’s an NP-hard problem. It’s like a traveling salesman basically. Can you explain what the vehicle or dasher routing problem is and how you approach it?
[0:25:19.3] RR: Yeah. In a general case, a vehicle routing problem is, let’s say you have a bunch of deliveries that need to be delivered to a set of customers and you have a fleet of vehicles at your disposal. How do you figure out the optimal routing of these vehicles in order to deliver all the goods? Think of what FedEx, or UPS, or Amazon does when they have a bunch of packages that needs to be delivered to a set of customers presumably with a bunch of stops in between.
The reason this is hard is the combinatorics of it. Let’s say you have five deliveries and you have five vehicles that you could use. There’re about hundred different combinations. But when this goes to like 15 deliveries, if I get my math right, that’s about a trillion combinations.
So the combinatorics of this makes it challenging. For DoorDash, it’s a similar problem and that we have a set of deliveries. We have a set of dashes who are available to pick up those deliveries and they need to be delivered to the consumers. What makes it challenging for DoorDash is the real time nature of the product. In case of UPS or FedEx, you know the orders beforehand. You know the set of packages and the set of addresses that you are delivering to when you start the day.
For DoorDash, the orders emerge on the fly. Any consumer could just open the app and place an order and they could request from any merchant, which means you don’t know where the demand is going to come from, and that makes it harder problem to solve. In addition, you have to deliver in 30 to 40 minutes. No one really wants to wait for food for, let’s say, two hours. So the real time nature of it makes the routing problem even more challenging.
[0:27:15.5] JM: So how do you approach it? If you’re going to – Let’s talk specifically, what are the models that are involved in doing vehicle routing? When you’re trying to generate – I guess the goal is to generate a route for a vehicle to drive to go pick up a piece of delivery and then deliver it to the user, right? Is that a spec for what kind of machine learning model we’re trying to build here?
[0:27:44.7] RR: Yeah. There are multiple things going on here. Let’s start at the input. So the input to this is we have a set of deliveries along with the locations of where it needs to be picked up and where it needs to be dropped off. We have information on dashers. Where they’re currently located? What’s the capacity? Whether they could take a big order or they will stick to the smaller orders.
The output of the systems needs to be a mapping between a dasher and a delivery. You say for each dasher they would go pick up this order and then drop off at this point, or they could be operating on multiple orders. They could pick up one order, pick up the next order and then drop off the two orders.
The core part of this is a matching problem. We use a variation of integer programming for this. So you can think of it as the optimization piece. Where machine learning comes in is in providing the inputs to the optimizer. For example, the optimizer needs a reward function or an objective function. Presumably, travel times would be an input to the objective function. You would have a machine learning model that predicts the travel time between two points. Similarly, you can have a machine learning model that predicts parking time at a certain store.
So you start with data. You augment the data with predictions from certain machine learning models and use all the optimizer using what the data and the machine learning predictions and you get the output, which is the matching.
[0:29:23.6] JM: Why is this not a problem where you can just use Google Maps?
[0:29:26.8] RR: You could use Google Maps just for the routing part of it, which is Google Maps can tell you it would take you 10 minutes to go from this point to another point, but there’s more involved here. There is the merchant side of the piece, where you need to predict how long the merchant would take to prepare the food. You would have to look at multiple orders that are currently in process. How does the merchant timeline and the dasher’s timeline match up?
Parking is another area where using specific estimates becomes important. There’s also time spent at the merchant, which is how long does it take for the food to go from the kitchen to the counter. How long do you think the dasher is going to have to wait in the line at the merchant?
There’re more such nuances to the problem.
[0:30:15.6] JM: How do you get the feedback for that data? That data is not publicly available at the amount of time you have to wait for the order, unless the dasher has to put that in for some reason. Does the dasher show up to the restaurant and then like say, “I’m here, and now I’m waiting in line,” and things like that?
[0:30:37.7] RR: Yeah, they do. We have two sources of that data. One is from the dasher’s input and the merchant’s input, and the other is you could track their time spent when time spent traveling, versus the time spent parking, versus the time spent at the merchant. So as you get more data, your system can learn from the historical data to get better estimates on this.
[0:31:06.1] JM: Okay. Can you tell me your approach to making this routing system and then how often it gets updated, and walk me through like the batch jobs, and I guess – Yeah, I guess the batch jobs. The nightly batch jobs that are generating the different components of this.
Break down the engineering process.
[0:31:29.4] RR: Yeah. The easiest way to think of it is think of the optimization piece as one setup, and the machine learning piece as another setup. There are multiple predictions in the machine learning piece. You can largely think of them as interchangeable, as in the same process applies to multiple, if not all of these predictions. So some of these predications are real time. For example, to predict the delivery times, you have to look at the real time data coming in and make predictions. So while your training is done offline through the batch jobs that we described before, the prediction happens online. So let’s dive in to that.
So the evolution of this job, so when you decided you want to build a model for this, you would set up an Airflow job that gets the data, that gets the features and trains a model. You evaluate the model. Once you’re satisfied, you publish the model. From thereon, the model is available to make predictions on. So that’s the first stage. That’s the training stage.
This could take multiple iterations in identifying what works best, what sort of model works best, what sort of parameters works best. Once that’s done, the model is ready to be used, you could add them as added into a daily job. So you retrain on new data that’s available.
The second stage is the predictions piece, where in real time when you get information on a particular delivery, and let’s say you have real-time information, such as who’s the market looking right now? How many dashers do we have on the fleet? What’s the type of order?
What’s the number of items in the order? We get this real time data.
You also get additional historical data on, let’s say, the historical delivery times in this market, historical delivery times at the store. So you combine these two data in what we call a prediction service, which handles a lot of these models. So the input data comes in – The features data comes in. you make predictions on the model and you get an output of it.
In addition to that, you have monitoring on top of it to make sure the models are behaving as you expected to, whether the predictions are in the range that you expect to. Whether there’s any inconsistencies in the features. So that’s another engineering side to it. That’s the machine learning piece of it.
So the way you trade on it is you improve the model. You would run a set of experiments to see, one, if the model is performing better. Two, if the usage of the model is improving the system overall. That’s sort of how you would improve the system.
[0:34:26.7] JM: How do you bench market and validate it? When you have the V1 of the model and then you train a V2, how do you benchmark that V2 is better than V1?
[0:34:38.8] RR: Yeah. We do a number of things. The first part of it is validating on offline data, which is if the model is better, you should see it in the past data. You would verify – [0:34:53.1] JM: Back testing.
[0:34:54.4] RR: Back testing, right. You would verify on historical data. The second stage we do is we launch the model into production, but use it as a shadow model, which is you would make predictions using both the V1 and the V2, but only use the predications from V1. There are couple of reasons this is useful. One is it points out if there are any differences between the training environment and the prediction environment. That’s one.
The second is it points out if there are any fundamental difference between the back tested data’s distribution and the real time or the new data that’s coming in. So that’s the second stage. The first stage is back testing on historical data. Second stage is you integrate it into production to a shadow. The third stage is we run an A-B experiment, where we send some fraction of the data to the new model, wire it all the way into the system and we see the effect of the two models and measure on the business metrics which one performs better.
[0:36:04.0] JM: Okay. Let me reiterate those back to you to make sure I understand them appropriately. The process of if you have a new version of a machine learning model, the process of rolling it out is, step one, back test it on historical data, and you can test V1 and V2 side by side. You have the results of the V1, because that was the actual production model. Then you can simulate the same inputs that were given to V1 and you can see how in a simulated environment in a back testing simulated scenario what would have happened if you were instead using V2. Then if the results are better, then you can do shadowing. Shadowing would be taking live production data and running the V1 and the V2 over live production data. So you’re just shadowing. V2 is just being shadowed and you’re just like looking at the results there, and you’re still acting only on the V1 data, because you want to be a little bit cautious there, but you now have production data that’s being fed to V2. So V2, you can get a little bit more reflection on that.
Then the next step is to maybe test 5% of your traffic on V2, while 95% of the traffic is still going to V1 so that you’re doing this slow and steady rollout, and you can gradually increase the traffic overtime if V2 still looks like it’s better.
[0:37:34.6] RR: Yeah, that’s right.
[0:37:36.1] JM: The back testing part of it requires a simulator, because you need to – You take this routing example, you can’t have your V2 model actually be run in history. So do you have a simulator? How does the simulation process work?
[0:37:55.1] RR: Yeah. There are two things here. One is the performance of the machine learning model by itself, which is how accurate is it in predicting, let’s say, delivery times, or in predicting parking times. For that, you just look at true data and then compare it on another metric. Let’s say you compare the average difference between your prediction and the true value. That’s one part of back testing.
The second part of it is how does this integrate into the rest of the system. For that, we have a simulation framework where we replay the historical set of deliveries and use the V2 reserves and see how the optimizer would act differently given the V2 reserves. So this would be an endto-end testing where once we have tested the model’s accuracy in itself, we put it into this simulator, look to see how that would change things in the optimizer. Hence, the business metrics that it affects.
[0:39:01.6] JM: Okay, interesting. Are there any particular difficulties in that machine learning role out process, or do you feel like the machine learning infrastructure that you have in place for optimizing models and then deploying the new models, do you feel like it works okay for you?
[0:39:19.6] RR: It works mostly okay. The different stages are useful in identifying what’s working and what’s not, in the sense the biggest different you could see is if the data that you used in the training setup is vastly different from the data you used in live production data. The shadowing setup helps us identify the differences and act on those. The framework we have is pretty useful in that respect.
[SPONSOR MESSAGE]
[0:39:54.5] JM: If you’ve ever been a tech news junkie, you’ve probably checked out Techmeme. Techmeme.com is a great website for finding out what’s going on every day in the tech world. It’s a highly curated set of content around technology news, business news, and not they have a podcast; The Techmeme Ride Home. It’s a short, 15 to 20-minute podcast that you can hear on-the-go Monday through Friday. It might be a good complement to Software Engineering Daily and it’s certainly more concise than Software Engineering Daily.
You can tune in to Techmeme Ride Home to find the latest headlines, context and conversation around what is happening in the world of tech. You get everything from the top new stories to hearing about the top posts, conversations and tweets, because who has time to get all of these stuff from the top of the funnel? It’s great to get it condensed down into a 15 to 20-minute podcast. The podcast is hosted by Bryan McCullough, who has been running the Internet History Podcast for several years. That show is awesome as well.
By the way, I have listened to a lot of Brian McCullough on the Internet History Podcast and I really enjoy his ability to give perspective both historical and contemporary on what’s going on across the internet. So check out the Techmeme Ride Home Podcast and subscribe today if you like it.
You can give your eyes a rest from the many news and information aggregation sites across the web and get it in podcast form. Check out the Techmeme Ride Home, and I hope you like it.
[INTERVIEW CONTINUED]
[0:41:51.3] JM: You’re operating across over all these GOs, and I can imagine that there are certain models that perform really well in one geo but not performed well in another. So there are some importance of sampling, right? In each of these phases actually. I mean, you want to, in the back testing scenario, you probably need to sample back testing on data across all the different GOs. Then as you’re doing the rollout process, you probably have to gradually release it to different GOs or maybe take 5% of traffic, but make sure that you sample all the different GOs. How does that GO selection affect the rollout process?
[0:42:33.5] RR: Yeah, that’s a great point. The rollout process is done on a global level. So let’s say you do 10%, that would be 10% across all the GOs. So the different regions would be proportionately represented in it, but that aside, your models tend to work well in markets with a lot of data. That’s where really the sampling comes in when training the models.
If, let’s say, there are two regions, one of it has 80% – The data is distributed as 80% from region one and 20% from region two, your model that you trained could do excellently well just on the 80% and get a good score. So the sampling becomes important in training. So we identify and [inaudible 0:43:21.7] these cases, where the model that’s well only in the bigger market.
[0:43:27.1] JM: At the beginning of this conversation, we touched on the variety of different moving pieces here and all the different areas that there are for machine learning to take place and to optimize the different things. So you can only focus on so many machine learning challenges at a time. How do you pick which models to focus your time on and what are you focused on these days?
[0:43:57.0] RR: It depends on how mature the different models are and where we want to focus on as a business next. For example, let’s say the model that predicts delivery times in a good state and we feel the incremental improvements there is limited, but there are whole hosts of other models that we want to start looking into. Let’s say on the search ranking side, on the supply-demand side, which is how do we balance the supply of dashers and the demand from consumers and make sure this is well-balanced. You would start to focus more on that.
To answer your second part, currently a lot of the focus is on, one, the morals that feed into the logistic system, and particular on the market management, the supply-demand balancing side and on the consumer recommendations and search ranking side.
[0:44:56.9] JM: So is that driven by the fact that you think that by focusing on those particular models or those particular domains, you can drive the KPIs that the company is focused on right now.
[0:45:11.6] RR: That’s exactly right. It’s where you think you have the highest leverage on impacting either the company’s growth or the company’s profitability.
[0:45:23.1] JM: What’s the team structure and how is work shared between different members of the organization? How can data science and machine learning teams work together effectively?
[0:45:34.2] RR: Yeah. So here are a number of different ways that different companies do this. The way we found that work the best for DoorDash is we have a centralized analytics team, which focuses on data sciences and product analytics across the company. We also have machine learning engineers working on specific engineering teams across the company. For example, we have a set of folks working on machine learning within logistics. We have another set of folks working on machine learning within the consumer side.
The way work gets structured, is it’s more around the projects that you work on. Let’s say you work on a particular project that’s focused on better predicting demand. You would have a team that’s a backend engineer, a machine learning engineer, a data scientist and a product manager. You would get together, figure out what problems you are going after, identifying the morals you would build, identify what a data scientist could help with and what a machine learning engineer could bring in and you share the work accordingly.
[0:46:49.8] JM: What about the data platform side of things? Is there an entire team or an individual who’s devoted to working on that data platform, the ETL jobs, and the data transformations, etc.?
[0:47:01.0] RR: Yeah. So there is a data infrastructure team that focuses on the data needs across the company. It would be the ETL and the data processing. It would be on business reporting, on the machine learning pipeline. Any other tools that people use to access data. For example, any querying tools or any sharding tools.
[0:47:25.5] JM: What are the tools that you’re using these days for data science visualization, model development, model iteration, deployment? Give me an overview of the tools.
[0:47:36.1] RR: Yeah, for machine learning, we mostly use python-based open source libraries, the scikit-learn LightGBMs of the world. That’s where we train the models, iterate the models on. The other package is Keras.
On the data querying side, or like in more general, analytic side, people use some mix of Python and R and plugin to the data, which is also used for different exploratory analysis and visualization. We use a mix of Charteo and Tableau for more business reporting and visualization aspect.
[0:48:15.2] JM: Cool. Keras specifically. So I think Keras is like abstraction that’s higher level than particular machine learning framework. So it’s something that – Doesn’t it compile down into TensorFlow or something? Tell me about what Keras does.
[0:48:30.2] RR: That’s right. You can think of Keras as an API on top of other deep learning frameworks. You could use TensorFlow. I believe you could also use PiTouch. I’m not 100% on that. But what Keras does is it provides an API where you could easily define your model. It could be a logistic regression model. It could be a neural net model. It’s straightforward to define exactly what you want. Keras handles the heavy lifting on how do you translate that into the TensorFlow computation engine run – For example, in case of neural, run the different layers, run the forward propagation on it, run the back propagation on it. Use different gradient functions and so on. So it’s a nice easy to use abstraction layer.
[0:49:21.0] JM: I want to revisit the routing problem a little bit more. Can you break it down a little more granularity? How many parameters are there? How many factors are there that go into the model, also the different layers of the model and how those layers have been developed? Just give me a deeper dive into the view of the model and how it’s programmed.
[0:49:45.8] RR: Yeah. So let’s start at the level where we have a sort of deliveries and a sort of dashers. The task is to do a matching between the two, and to do that you would define an objective function. Let’s say it’s a combination of multiple things, one of which is the delivery times.
So the parameters in this case are the different components that form the objective function. Delivery times could be one, travel times is another, food preparation time is another, parking time is another, and so on. They could be parameters that are specific to certain GOs, parameters specific to certain merchants, parameters specific to certain time of day. That is a mix of – So when you talk of one model that comes in, let’s say the parking time or the delivery time model, that’s trained on somewhere between a hundred to a thousand features. These are historical features that is used to train the model. Each model is responsible for one parameter that feeds into the optimization function.
[0:50:59.9] JM: Okay. Can you dig a little bit deeper and talk about the programming feedback loop and how you translate those different parameters into code and just what that code writing process looks like for a machine learning engineer?
[0:51:15.3] RR: For a machine learning engineer, there is plugging it back to the two stages I mentioned before, that is the training stage and a prediction stage. For the trading stage, the code writing process would be talking to different data sources, identifying the features you want and collecting these features and trying out different models.
For example, let’s say you’re building a new model and you identified a set of hundred features and you are ready to train a model. You would use those hundred features, use let’s say the LightGBM library or the Kares library define a particular model. Apply these features on those models. Measure the performance on a particular accuracy metric and rinse and repeat. You would do this till you’re satisfied with the model performance and you have a model and you have identified a set of features that work best for the problem.
From there on, the next step would be to integrate this into the production system, where for a new delivery that’s coming in, you want to access the same sort of features. So the development process there would be you would identify the model that you’re using. From there, get the features that the model needs. Make sure you provide those features. Get the output from the model using those features and feed into the optimizer function.
[0:52:39.2] JM: Okay. Let’s zoom out a little bit. You’re writing machine learning jobs on a daily basis, and I’ve heard from several people that when you’re working with machine learning tools, it feels like it’s early in some sense and it feels like some of the things are harder to do than they should be. The tooling feels immature in some ways. Are there any particular ways in which the machine learning tooling that you work with on a daily basis feels like it’s a little bit primitive or earlier than it will feel in 5 years?
[0:53:15.1] RR: 100% agree with you. It’s super early days in the whole machine learning industry I would say. For example, if you’re running a service, there are well-established and widely accepted process on how you deploy this service, how you monitor this service.
Presumably you would look at the latency and the throughput. So those are pretty well-defined.
But when it comes to machine learning, we don’t have it yet.
A big learning I have working at Godash is the hard part of machine learning is not really the algorithms piece. It’s not really figuring out how to get the best accuracy, but more figuring out how the rest of the ecosystem works with that, which is how do you manage the lifecycle of a model? How do you make sure the performance is consistent? How do you track the various data pipelines that feed into this? How do you monitor this? How do you alert this?
What we identified and what’s been working well so far for us is overtime, as you build different models, you identify a set of things, a set of good practices to do that helps with managing a model better. So we build this all out into a service such that we make it easy to do the right thing. For example, the service would handle the models monitoring automatically, which is any machine learning model that you build, you would automatically get tracking on how the performance of the model is and automated alerting on top of it.
For example, you would want to know if suddenly the model that predicts delivery times is predicting 100% higher values. So that’s an example of a tool that we designed that helps with the model development process. The shadowing that I mentioned about earlier and the experimentation setup is other ways. We are working around this to get us more confidence in building and deploying machine learning models.
[0:55:25.4] JM: What do you think of Google’s AutoML product?
[0:55:28.9] RR: Yeah. I haven’t used it myself, but I’ve been hearing a lot about the Google’s AutoML product and Amazon’s SageMaker. There are also a couple of other products in the market. I think they are in the right direction. There is a lot of processes in developing a machine learning model that could be easily abstracted so that you could focus on the core problem solving part of it.
I think those tools are in the right direction. I’m pretty excited for how they evolve in the next year to two years.
[0:56:03.8] JM: Definitely. Okay. Well, Raghav, maybe we could just close off with your thoughts on the future of DoorDash and what product developments you think you’ll be working on in the near future. .
[0:56:14.3] RR: Yeah. Food delivery is a massive space and we’re just getting started. So I definitely see us continuing in that delivering on what set out to do, which is helping the local businesses. In the future you would see DoorDash doing and becoming more of a logistics platform for last
of that coming up coming into the picture where the user, the logistics engine, to do more of the last [inaudible 0:56:52.0]. That’s an example of that recently where we partnered with Walmart to power their online groceries. So you would see more of that coming up, coming into the picture where the user, the logistics engine to do more of the last [inaudible 0:56:51.5] commerce. A lot of the problem solving is going to be focused on how do we make this logistics engine more efficient, more useful for a lot more of [inaudible 0:57:03.2].
[0:57:04.4] JM: Okay. That’s sounds like a good place to stop. Thanks Raghav. I appreciate you coming on the show. It’s been great talking.
[0:57:09.4] RR: Thanks, Jeff. I really enjoyed the questions.
[END OF INTERVIEW]
[0:57:14.8] JM: If you are building a product for software engineers or you are hiring software engineers, Software Engineering Daily is accepting sponsorships for 2018. Send me an email, jeff@softwareengineeringdaily.com if you’re interested. With 23,000 people listening Monday through Friday and the content being fairly selective for a technical listener, Software Engineering Daily is a great way to reach top engineers.
I know that the listeners of Software Engineering Daily are great engineers because I talk to them all the time. I hear from CTOs, CEOs, directors of engineering who listen to the show regularly. I also hear about many, newer, hungry software engineers who are looking to level up quickly and prove themselves. To find out more about sponsoring the show, you can send me an email or tell your marketing director to send me an email, jeff@softwareengineeringdaily.com.
If you’re a listener to the show, thank you so much for supporting it through your audienceship. That is quite enough, but if you’re interested in taking your support of the show to the next level, then look at sponsoring the show through your company. Send me an email at jeff@softwareengineeringdaily.com. Thank you.
[END]