

Current State of Monitoring in DevOps and SRE


In this article, we’ll be going over the current state of monitoring in DevOps and the role played by Dynatrace explained to us by Aloïs Reitbauer, the VP & Chief Technical Strategist at Dynatrace in a conversation with host Jeff Meyerson.
Development Operations (DevOps) is a methodology that uses a set of tools to ensure the smooth deployment of software applications. It’s generally comprised of a set of practices to have the cleanest way to test, release, and deploy software based on the specific requirements of the organization.
These roles originally were just a part of the job for a software engineer but as time passed these operations pipelines grew larger and more complex — making what was a side thing to care about for one developer to a full-fledged role that companies hire for, specifically.
As host Jeff Meyerson puts it,
“The whole DevOps SRE movement is still very young. And it’s evolving very quickly. And part of the reason it evolved so quickly is because the state of the art in tooling has evolved really quickly.”
It’s funny when we think about it, we went from DevOps (Literally developer operations), being a thing that was handled by developers to a point where companies now hire folks for this specific role.
The complexity, however, hasn’t gone down since, paving the way for tools like Dynatrace. This complexity is what made deploying and monitoring prone to errors and overall ended up being quite hard. Even more so for large firms, who as opposed to startups have an immense amount of technical debt to take care of before moving to the latest and greatest deployment architecture.
Developing a monitoring platform is hard! As Alois Reitbauer states,
“you have kind of like an inception problem if you deploy a monitoring platform because you have your application that’s monitored by the monitoring platform. And then the monitoring platform, which requires you to have higher availability of the application, you will then again need a monitoring platform for it. And you’re kind of going into this inception model of, “Yeah, who’s monitoring the monitoring platforms?”
No one wants to end up being in paralysis by analysis situation but at the same time, engineers (and subsequently other stakeholders) want to derive as much as they can from the data they have/can collect.
Monitoring can be generally subdivided into five general sub-categories: Application performance, Infrastructure Monitoring, AIOps, Digital Experience, Digital Business Analytics.
Infrastructure Monitoring
Infrastructure monitoring is probably the thing that most developers think of when they think of monitoring related to DevOps. This form of monitoring revolves around gathering data about availability and performance of your IT infrastructure with a goal of improving speed and reliability in the long run.
However, as with anything, monitoring itself is never enough, and as we’ll come to know in the coming subsections, Dynatrace has found a neat way to leverage this data around your infrastructure.
APM (Application Performance Monitoring)
Application performance monitoring loosely can be classified as “a concept for managing application performance across many diverse computing platforms, rather than a single market.” At its very core, it’s just taking care of your application’s performance, availability, and user experience metrics. Most organizations end up logging the speed of transactions performed in the production environment.
Dynatrace provides more than just monitoring. Developers using Dynatrace can even end up providing fallback scenarios in case the application faces degraded performance due to any reason. As Reitbauer said,
“Obviously, this is not like a healing situation for everything. We’re not making systems to run fully autonomously, but it can take a lot of these manual tasks out of the equation. It only escalates to a human operator when it’s really necessary.”
Think about a company like SAP where thousands of developers commit on a daily basis, Dynatrace has reduced their mean time to response by 60% by using their AIOps providing self-healing and auto-remediation wherever possible.
Digital Business Analytics
Business analytics is the act of monitoring what actually brings money into the bank – transactions. It’s also commonly referred to as “transaction monitoring” or “BizDevOps” for this reason. Essentially, a transaction monitoring tool would end up looking at transaction flow(s) across your application and keep a tab on response times for each individual critical business service.
Dynatrace’s Business Analytics provides an effective solution here, by using a mix of application performance coupled with the user experience they provide effective business KPIs that can be then utilized by IT for purchasing resources in the most effective fashion. The team over at Dynatrace conducted a survey for the same, finding most of BizOps efforts are non-effective and those who claim effective collaboration have successfully created a coupling between business analytics and their IT operations. See a chart from their survey below.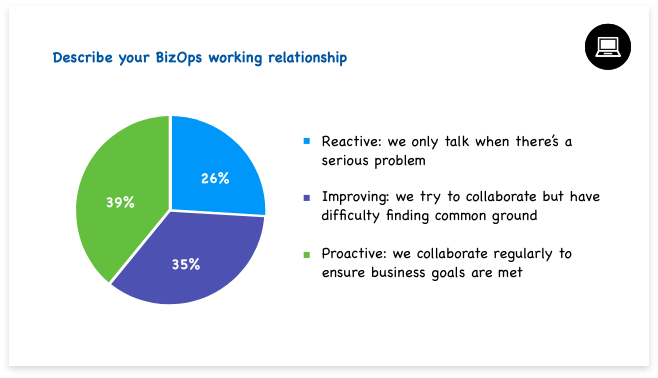 AIOps
AIOps
And then our customer said, ‘’Well, if you already know what the problem is, why don’t you fix it?’’
Reitbauer says as he explains how the customers came up with the challenge of asking Dynatrace to provide solutions to the problems they were facing with their infrastructure-related problems. Since your application (based on the size of your application) may be offloading logs worth hundreds of gigabytes over onto Dyntrace once these disparate logs are consolidated, any abnormalities are fairly easy to get hold of.
AIOps is a way of leveraging Machine Learning-based algorithms to filter out noise coming from the data collection pipelines and figure out abnormalities (and in some cases, offer remediation strategies too).
However, as described in Dyntrace’s blog, traditional approaches rely on a vast amount of data first, to then learn and predict (and eventually apply reinforcement techniques). Oh, and not to forget how frequently infrastructure itself might change, which would bring the system back to square one.
Dynatrace’s built-in deterministic AI operates on its own raw data with topology information from the client’s architecture. This is bypassing the building/rebuilding of context from aggregated data required by most traditional solutions in the market.
Digital Experience
Digital Experience is essentially drawing conclusions provided by the data via Application Performance Monitoring to ensure applications end up being performant and functional for the end-user.
This sort of monitoring allows the company to have a birds-eye view over the customer data and realize performance issues such as Largest Contentful Paint (LCP), First Input Delay (FID), and Cumulative Layout Shift (CLS) before they actually end up causing disruptions for the larger audience.
Dynatrace is a well-established player in the DevOps monitoring space. The vision laid down by Reitbauer, paints a clear picture too as he said toward the end of the interview:
“where I see Dynatrace fitting, and we always need this to be data-driven… We need to automatically drive decisions and drive automation. And automation works better the better your data is. Doing automation on faulty or incomplete data does not lead to good automation. And our goal is really to provide the best quality data to do the best analysis of this data so that you can build high-quality automation on top. And obviously allowing this to do seamlessly in an easy and quickly that this does not become a massive integration project by itself.”
As Reitbauer points out towards the end, the integration of the various data pipelines when combined together leads to insights that are unparalleled to the current state-of-the-art, however, the key challenge for Dynatrace here would be to move fast, in a sense but without causing major disruptions to the pre-existing infrastructure they have built up.
To listen to the full interview, click here. And to learn more about Dynatrace, visit dynatrace.com/se-daily.


