

Spend Less Time Debugging and More Time Building with Scout APM


In any online business, it’s of paramount importance to catch any visitor’s attention within a few seconds. If they cannot find the information they are looking for in a set timeframe, they will jump ship. As a developer, when you have only these valuable few seconds, it would suck to waste them on performance issues. Customers will not even wait 3 seconds for an unresponsive page before closing. Every second matters, and when you have a large enough platform, every second you waste in loading a page means lost revenue.
Running a website is not easy – you have to be on guard for any disasters. A singular API call can be a bottleneck that brings the whole experience down. At irregular intervals user traffic can spike unexpectedly. Perhaps an image you’re using is not optimized. A certain line of code can be buggy, and cause delays. The possibilities are endless, and a developer is defeated without the right tools.
This is where application performance management (APM) tools come into play. Performance monitoring is important for customer retention, customer experience, and even for search engine optimization. A powerful APM tool can help you, as the developer of a website, to detect and react to performance issues in real time, and to precisely identify what in your application is causing this issue.
Scout APM is a powerful tool to have in the arsenal of a DevOps team. It is a lightweight service that runs alongside your application in production, and sends monitoring data to be analyzed. Scout APM supports a wide range of applications, including Ruby on Rails, Elixir, NodeJS, Python, and PHP. Even if your application language is not among these, don’t fret! Scout’s Core Agent API provides cross-language common functionality, and assuming that you can send messages over a Unix Domain Socket, you can make your application work with Scout APM.
Scout APM’s clutter free user interface streamlines proactive and real-time insights. The graphs get updated in real-time, and from a general overview, it’s as simple as clicking and dragging to dive into a few select activities.
With basic APM tools, you have to wait until the performance issue is reflected in a customer’s journey on your website, and only after several traces you can detect that there’s a bottleneck, and you will have to investigate to find what causes this bottleneck. This kind of reactive monitoring is important, as real-time problems will always arise, even in areas completely out of the developer’s control such as data centers and cloud servers. However, the detective work of trying to identify what causes the bottlenecks is not necessary. Scout APM not only allows you to detect and handle issues with constant monitoring, but it also empowers you to pinpoint a single line of code or a single SQL query that causes the performance issue. Scout gives you the fastest path to a slow line of code.
The best part is, you can dive into a single transaction easily through Scout’s UI, and directly see the line of code that caused the bottleneck. For method calls that take longer than 500 milliseconds to complete, Scout automatically provides code inspection with its Github integration.
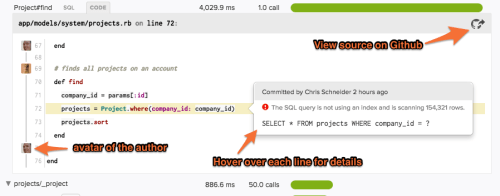
It’s not only important to find the issue, but also who to notify to get this issue fixed. With Scout, in the code view, it is possible to see which line caused the issue, the author of the code, commit date, and deploy time, so that you can easily and immediately know who to ping for a fix! This frees up valuable team bandwidth, and results in a much quicker fix.
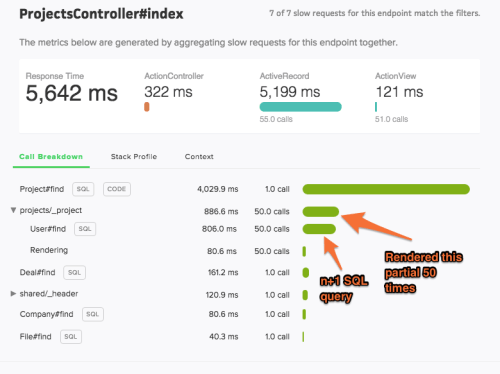
For each transaction trace, Scout is able to give a summary overview of method calls, sorted from most expensive to least expensive. As you can see in the following example, there is a [CODE] button next to this particular trace, that enables diving deep into the particular lines of code that cause the issue. With the [SQL] buttons you can also see each SQL query that has been run for this trace, without having to change views.
With the database monitoring addon, you can dive even deeper into your database performance. You can easily identify expensive queries, and find where this query is exactly called. You can get the answer to important questions like “Which queries are most impacting app performance?” and “Which queries are consistently slow?”
After going through all these lengths to monitor and optimize the code and queries, you have to make sure that the APM tool you are deploying is not causing much overhead itself. An APM agent, like any piece of software, when run in production uses resources and causes latency. The important part is to pick an APM tool that minimizes this overhead as much as possible while retaining functionality. Thankfully, Scout APM is very lightweight, and according to several benchmark tests it causes much less overhead compared to its competitors.
It’s easy to install and deploy Scout APM in production: it’s just 3 small steps for a Ruby application. You don’t have to install anything on your servers. Scout can also run in Docker containers or on Heroku without any special configuration. You can also run Scout alongside your existing APM solution – try it out and see which one benefits your team more.
You cannot afford to run a slow website. You deserve to have the power to stay on top of your application, with constant monitoring and insights. Start a free 14-day trial on Scout APM now, no credit card required. What’s more, Scout APM is dedicated to support open source software and will donate $5 to an open source project of your choice when you deploy. Do not pass on this opportunity, and make monitoring easier with Scout APM.


