Project Health: Assessing Open Source Projects with More Context
I have a habit of scrolling through Hacker News at least once a day, checking out both its front page and the “new” section. Besides getting a general pulse on what developers like to share and discuss, I love discovering new open source projects. Some projects gain temporary fame, though most only get only a […]
I have a habit of scrolling through Hacker News at least once a day, checking out both its front page and the “new” section. Besides getting a general pulse on what developers like to share and discuss, I love discovering new open source projects. Some projects gain temporary fame, though most only get only a few upvotes, but it’s the increasing frequency of more and more open source projects being developed and showcased that’s a noteworthy trend.
Both veteran technologists and investors have picked up on this trend for sometime. While Marc Andressen famously declared in 2011 that software is eating the world, it’s really open source software that’s eating the world.

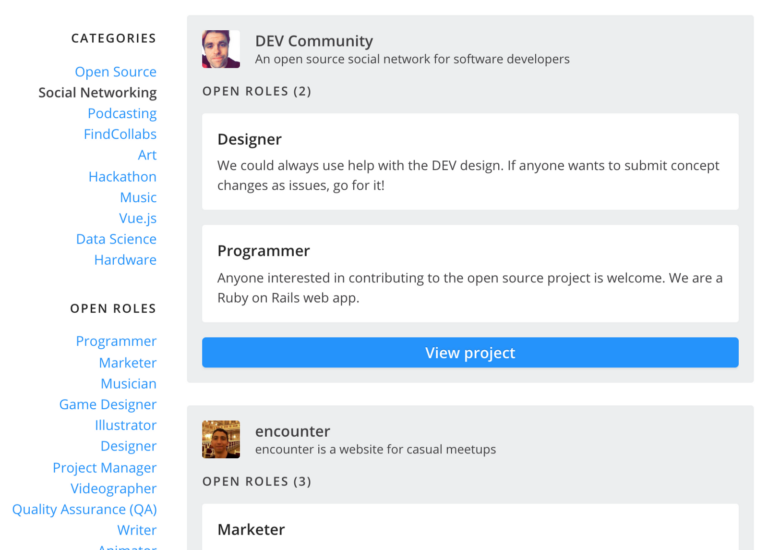
The open source development phenomenon, however, presents a new set of questions. Which projects can be used in a production environment and which ones are still experimental? Which projects are actively maintained and developed, and which ones are idle or dormant? Which projects are responsive to and inclusive of outside suggestions and contributions, and which ones are not? Ultimately, which projects are “healthy” enough to use in the real world?
These are questions that developers, particularly those working for end user organizations and are now the primary deciders of technology adoption, need to answer constantly. And as obvious as these questions may seem, they are surprisingly hard to assess when looking at a project’s repository (repo), mostly on GitHub, because the most prominently surfaced metrics on GitHub often lack context, can be easily gamed, and thus not useful enough to assess a project’s “health”.
(Note: this post is not aimed to pick on GitHub. I love GitHub as do many developers; it’s the default destination for developers to host and collaborate on projects. But with this great power and influence comes great responsibility and scrutiny. And I hope the analysis and suggestions presented here would be helpful not only to GitHub, but also GitLab, Bitbucket, and other project hosting and collaboration services.)
Twinkle Twinkle Little Star
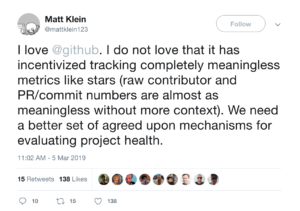
The number of stars attached to a GitHub project is the most visible and least meaningful metric of them all. It’s the quick dopamine hit to the project creators and maintainers, what “likes” and “hearts” are to the ordinary social media users. It’s often cited as a shorthand for project popularity or momentum, which isn’t totally meaningless and does provide a “smell test” for developers to decide whether to spend more time looking at a project or move on.
However, because it’s a vanity metric, and thus plays into the pride and insecurity of all human beings, the stars feed a popularity contest that overexposes a symbol without context, while creating noise that masks a project’s true health, usability, and usefulness. It also incentivizes marketing practices and competitive comparisons that are solely anchored on star count.
Most developers seem to have picked up on this. The only utility GitHub stars has seems to be a bookmarking tool for projects developers find interesting. Thus, the motivations for starring can vary widely from “cool idea and design”, to “the creator is famous so worth following”, to “I want to dig deeper but don’t have time right now”.
How I Wonder About PR
The number of Pull Request (PR) is another metric that often gets cited as a reason why an open source project should (or should not) be taken seriously. It’s more meaningful than star counts, but sadly not by much. It’s a decent indicator of a project’s rate of evolution and capacity to efficiently consider and absorb suggestions from the wider community; the ratio of open-to-closed PRs can be a shorthand for that evaluation.
But not all PRs are created equal. Any given PR can range from a significant component that presents a major step forward in a project’s roadmap, to relatively straightforward bug fixes that should probably be filed under “issues” (more on that later). The labels being applied to tag and sort different types of PRs are project-dependent, thus wildly inconsistent. For example, the PR page of the popular Kubernetes can look like a bursting rainbow, while the similarly popular and useful etcd (on which Kubernetes actually depend) has a PR page that resemble a zenful meditation retreat, with hardly any labels at all.

Kubernetes PR page screenshot (taken April 3, 2019)

etcd PR page screenshot (taken April 3, 2019)
Similarly to the star count, it’s a metric that can be gamed. By filing and closing lots of small bug fixes as PRs, or intentionally breaking down a large component into smaller parts just for the purpose of increasing PR count, this metric can be abused. There’s nothing wrong with decomposing problems in development of course; it’s more often the preferable engineering practice than not. But as an outside developer examining a project, she can’t easily tell and PR counts can’t help her tell.
Contributors and Issues
I used to place a lot of value in the number of contributors. After all, the number of developers who would bother spending time contributing code and fixes to a project must speak volumes about the project’s value, potential, and the people maintaining it. Sadly, the picture isn’t that straightforward — it’s another metric that can be artificially inflated if it’s known that having a higher count would make a project look more promising.
For one, not all contributions are created equal, but all contributors appear to be equal. Did you provide a significant bug fix or build a feature? Contributor. Corrected a few typos in the documentation? Contributor. Removed some whitespaces to make the formatting prettier in a markdown file? Contributor! You see my point. Of course, you can dig up these details by going through the commit history of each contributor, but that’s an onerous investigative process that most developers don’t have the time to do. Thus, the contributor count at a glance became yet another out-of-context vanity metric.
On the other hand, the number of issues is something I’ve started to pay more attention to than before — as in more issues the better! Counter-intuitive perhaps, but for me, more issues actually mean more “health” and more traction. There’s no piece of technology that doesn’t have issues, and a project’s rate of maturation is tightly linked to the rate in which issues get discovered, filed, and fixed. One of the core differentiating strengths of the open source development mode is that the entire world’s developer community is theoretically your Q&A team, thus an open source project that has a lot of issues has likely tapped into that strength.
However, issue count also suffers from the same set of weaknesses as PR counts in that the labeling system is not standardized, project-dependent, and lacking in qualitative context. Without an easy way to categorize both the types of issues and the people who file them, the raw count can be rather misleading.
How Do We Surface Context?
To be clear, the major GitHub metrics that I’ve poked holes in are not all meaningless, but their meaning is often inflated, open to abuse, and ultimately don’t give developers enough information about whether a project is “healthy” enough to be trusted for production-level adoption. So how do we surface more “context metrics” to help check on a project’s “health” that’s hard to game?
Here’s a few ideas:
- Response time to PRs and Issues: the ability of a project’s maintainers to respond quickly to any given PR or issue can demonstrate the project’s capacity to grow, both in terms of technical improvement and people power. This metric is quantifiable yet hard to game. Any automated bot responses would not be counted, and human responses can be qualitatively assessed by applying natural language processing to conduct sentiment analysis, similar to what large e-commerce platforms already do to analyze customer service and reviews. In fact, customer service is the operative analog here (engineers are people too!). A project that has a customer service mindset when interacting with incoming requests, as measured by this metric, can help developers determine whether the project’s technology and people can be relied upon if she was to use it in a serious way.
- Standardized labels for “issues”: just a few standard labels that all open source projects would use to tag “issues” could go a long way in helping developers quickly see the context behind them. We can start with four: “Bug”, “Enhancement”, “Question”, “Support”, which corresponds to four distinct types of requests: “fix something”, “add something”, “curious about something”, and “help me with something” — the last one possibly indicating that the project is already deployed in production by the inquirer and serious support is needed. The project maintainers can (and should) use more labels to triage issues to an additional level of nuances relevant to the specific project at hand, but maintaining a breakdown based on these four types can give developers a helpful baseline context to the current state, direction, and community engagement level of the project.
- Standardized labels for project participants: as a corollary to standardizing issue labeling, it’s also valuable to sort through who is doing the issue filing and Pull Requests, and their respective roles in the project’s community. We can also start with four: “Maintainer”, “Committer”, “Contributor”, and “End User”, which correspond to the four main roles typically present in a functioning community. (Further breaking down roles to Issue Tracker, Tester, or others could also be helpful.) These labels would appear next to the account name of the person. Most well-maintained open source projects have a Governance document and Contributor Guide that lay out who are the key people and how does a new developer get included into the fold. The “End User” role, however, would require additional manual effort to confirm.
- Interoperability: perhaps the most valuable aspect of any piece of open source software is its interoperability with other open source projects, programming languages, or frameworks. It’s also an indicator of a project’s potential for wide, if not viral, adoption. This metric could be framed as a coverage percentage that include clients in different languages to third-party libraries to plug-ins. What exactly goes into this calculation will require more nuances as interoperability is use case dependent. But in general, surfacing the degree of interoperability would directly speak to a project’s usability. This is difficult to game, because achieving good coverage will require thoughtful upfront design, development time, and likely significant community contribution.
All four buckets of “context metrics” can be surfaced either as badges, labels, or graphs, and most of the data can be collected and updated automatically. There are of course many other contextual elements to a project that can and should be gathered and measured; this is just a start.
Hopeful Efforts
Some organizations are already doing work to expose interesting metrics to assess a project’s health. One example is the Cloud Native Computing Foundation’s devstats dashboard, which surfaces many additional measurements on its member projects, which are all hosted as public repos on GitHub. One metric I found instructive to observe is “Issue age”, which tracks the amount of time taken to close issues. It’s particularly interesting to check this metric on Sandbox-level projects, since they are defined as young projects in the cloud-native space that can be nurtured to gain maturity and wide adoption, or become defunct. At the moment of this writing, out of the 14 CNCF Sandbox projects, Telepresence has the shortest quarterly median “Issue age” at about 17 hours, while Brigade has the longest at roughly 4 days.
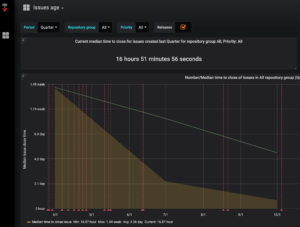
Telepresence’s Issue age dashboard screenshot (taken April 3, 2019)

Brigade’s Issue age dashboard screenshot (taken April 3, 2019)
Another effort worth mentioning is CHAOSS Metrics, which is a Linux Foundation committee whose goal is to build a repository that captures metrics for assessing open source community health and sustainability.
As the developer class gains more influence, power, and responsibility in deciding technology adoption, and as more open source technologies proliferate every level of any given organization, a more contextualized framework to assess an open source project’s “health” is much needed and long overdue.
——————
Please contact the author for permission to translate and republish this post in a different language.