Improving Debugging Workflow in Cloud Native Environments


The arduous process of debugging (Source: xkcd: Debugging)
Debugging is an essential part of software development. Bugs and errors cannot be escaped, and debugging these takes a considerable amount of time from every developer’s working day. In a recent quantitative study, it was reported that “failing tests cost the enterprise software market $61 billion annually. This equals 620 million developer hours a year wasted on debugging software failures.” According to the same report, it takes around 13 hours of work for a developer to fix one software failure. It is undeniable that debugging is an intensive task, and such efforts can be better utilized for developing or improving features.
Debugging practices have massively changed especially in the recent years with the rise of cloud and cloud-native applications. Cloud-native is currently the name of the game. According to CNCF’s 2020 survey report, the adoption of cloud-native tools have increased compared to last year, and the use of containers has increased 300% compared to the survey results from 2016. It is apparent that there is a gradual shift toward cloud-native applications, and every stage of software development has to transform to fit in with the cloud-native paradigm. Debugging is no exception.
Debugging in the world of cloud-native applications requires a whole different perspective. In a monolithic application that runs in your local environment, debugging is more straightforward, via well-known tools such as breakpoints and advanced debuggers of IDEs. However, when dealing with a cloud-native application, consisting of numerous microservices and serverless functions running in pods that you might not have direct access to, debugging gets more complicated. Where does this complexity come from?
Reproducing or tracking an error becomes harder when there are a lot of moving parts. If an error is related to several microservices, to reproduce it these microservices need to be run in a certain order, in the same version they were when the error occurred. While replicating this exact scenario is hard on its own, it’s harder to pinpoint exactly which microservice might be causing this error. When you factor in the possible asynchronous communication between microservices, or terminated serverless functions that might have played a part in this error, debugging gets even messier. How do developers in the cloud-native landscape deal with this complexity?
A very common solution is logs and performance monitors. By sifting through logs, or via inspecting performance monitors’ logs, developers might be able to pinpoint where and when an error occurs. However, there are a few caveats: when and where to print logs is in the hands of the developer. On the one extreme side, you can print a log message for every single line of code that you have, however, as you might imagine, this immensely increases the amount of logs that the developer later has to go through, and brings additional storage concerns. What to print in the said logs is also an important decision: logs are not always informative for specific problems. When logging, the developer has to work proactively, anticipating what kind of errors can occur and what information might be useful in debugging. If not, the developer has to add more logs and go through the painful process of CI/CD, deployment, and analysis – especially when not knowing where to look for the error, this trial-and-error effort can be very time consuming, storage intensive, and can sometimes be outright impossible when certain logs cannot be printed due to compliance reasons.

The landscape for tools tackling the challenge of debugging in cloud-native environments is rapidly growing. In this article, we will take a deep dive into one such production-ready tool: Rookout. Rookout, a tool developed for the cloud-native world, untangles the complex debugging practices and empowers developers to debug in the classical methods that they know.
Developers are used to debugging on their local machines, using their favorite IDE and debugger. It seems like a natural idea to replicate a cloud environment in a local environment, and try to debug locally. This might work when working with a limited number of microservices, but when you factor in large Kubernetes clusters, Lambda functions, and numerous microservices, the whole ordeal gets out of hand. The solution comes in the form of ‘remote debugging’. Remote debugging refers to, as one might guess, debugging applications running on remote machines. As one of its key features, Rookout allows developers to remotely connect to machines and put Non-Breaking Breakpoints, as if they would on their local environment. Rookout eliminates the need for writing manual log lines, restarting or redeploying applications. This way, Rookout lets you live-debug applications running on any environment, whether it be production, staging, or dev, without disrupting the running application.
After installing the Rookout SDK to your source code and deploying it across your environments, and choosing which environment and instance to connect to for debugging, it is as simple as clicking on a line of code to insert breakpoints. Rookout provides a web-based interface into your codebase that looks very similar to popular IDEs, and when you want a breakpoint on a particular line, inserts data collection instructions to your application’s source code via bytecode-manipulation. With these breakpoints, you get to see the full state of the application, with variable values, server information, and stack traces. When compared to the manual task of writing log lines to print all the variable values, Rookout saves precious time and effort by reducing the issue to a single click.
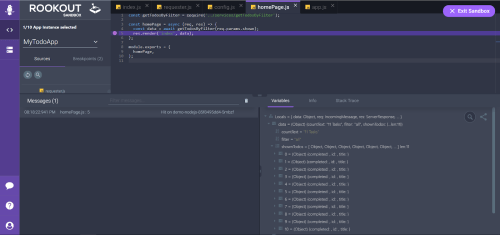
After inserting a breakpoint on line 5 of homepage.js, you can inspect variable values, server information, and stack trace via Rookout IDE.
With Rookout, you have total control over where to send the data that you collected. Rookout has integrations with tools such as Datadog, Logz.io, and Slack. This way, Rookout is not only a debugging tool, but can also be used as a monitoring solution. To monitor certain situations, or to reduce the amount of logs that you need to store, you can condition Rookout Breakpoints to trigger only when a condition is met.

Conditional Breakpoints: You can configure a Breakpoint to check for a condition via Rookout IDE.
A critical metric for any debugging application, or any SDK that is added to your source code, is performance. Rookout is lightweight – there is zero overhead until a breakpoint request is made. When adding a breakpoint via Rookout, the memory overhead is the same as when adding a log-line manually. The performance cost is dependent on how much data you want to extract from the breakpoint.
An important part of developing software in today’s standards is reliance upon third-party libraries and packages. With the rise of open-source software, cloud offerings, SaaS, APIs, and service mesh, reliance on third-party code is inevitable. These are in the best case open-source libraries and at the worst black-boxes. In the latter case, debugging can be a pain – you do not have access to the source code. Rookout has recently added a feature to help developers debug third-party code. By allowing you to place breakpoints in the stack trace, Rookout offers a glimpse into the inner workings of third-party code. You can view what data is processed by the method at hand, such as local variables and argument values.
Debugging third-party code. Rookout allows you to set breakpoints in the stack trace to any third-party method that your code uses.
Debugging is closely connected to performance issues – bugs do not always present themselves in errors, but they can lead to significant performance losses. Performance debugging is further impossible to fix locally. You cannot replicate countless pods, different configurations and versions on your computer. The answer is remote debugging, and so Rookout recently integrated server performance metrics into their tool. You can view server metrics within Rookout, and ease the process of performance debugging.
Rookout is developed with web/backend in mind – so Rookout SDK support JVM languages such as Java, Scala, and Groovy, as well as Node.js, Python, .NET, and Ruby. It can be deployed anywhere, with any infrastructure, whether it is on-prem, cloud, Kubernetes, or serverless. Rookout is also SoC2, GDPR, HIPAA compliant. Your source code never reaches Rookout’s servers – Rookout remains between your source code repository and your web browser. With a principle of least-privileges, Rookout integrates with other services using as little permission as possible. Give Rookout a try.